Gluster 3.12 vs 6 - A performance oriented overview
With the release of gluster 6 I decided to have a performance benchmark test with gluster 3.12 version to see if there was really any improvement seen. Used pg-bench tool to measure the performance.
PG-Bench is a simple program for running benchmark tests on PostgreSQL. It runs the same sequence of SQL commands over and over, possibly in multiple concurrent database sessions, and then calculates the average transaction rate (transactions per second). By default, pgbench tests a scenario that is loosely based on TPC-B, involving five SELECT, UPDATE, and INSERT commands per transaction
The methods I used to measure them are very simple. For those who want to know stick around others can jump straight to the results.
I started with installing gluster 3.12 hyper-converged environment on three bare metal machines using the cockpit-ovirt dashboard. I continued with installing hosted-engine managing the cluster. After the initial setup was complete I created 2 vms, one having disk allocation policy as “Preallocated” and the other as “Thin provisioned”.Once the vms were up it was time to setup pgbench.
Bare metal machine specs
| OS | Red Hat Enterprise Linux Server release 7.7 Beta (Maipo) |
| Processor | Intel(R) Xeon(R) CPU E5-1620 v4 @ 3.50GHz |
| Execution Technology | 4 cores; 8 threads |
Storage specs
| Model | Smart HBA H240 |
| Firmware Version | 4.52 |
| Controller Type | HPE Smart Array |
| Media Type | SSD |
| Capacity | 400 GB |
Following are the steps I did for setting pg bench :-
$ yum install https://dl.fedoraproject.org/pub/epel/epel-release-latest-7.noarch.rpm
$ yum install postgresql-contrib postgresql-server
Postgres stores its data files at /var/lib/pgsql/data thus on the two vms I mounted the device (/dev/sdb here) used for pgsql data.
Following are the steps :-
-
pvcreate /dev/sdb && vgcreate postgresql /dev/sdb && lvcreate -n pg_data -l 100%PVS postgresql /dev/sdb && mkfs.xfs /dev/postgresql/pg_data -
mount /dev/postgresql/pg_data /var/lib/pgsql/data -
chown postgres:postgres /var/lib/pgsql/data -
postgresql-setup initdb vi /var/lib/pgsql/data/postgresql.confshared_buffers=2048MB # approx 250 MB (1/4 memory of VM) effective_cache_size=4096MB # approx 250 MB (1/2 memory of VM) checkpoint_segments=8systemctl restart postgresql
Steps for preparing the test database:-
su - postgresbash-4.2$ createdb pgbench- Creating a 60G database
bash-4.2$ time pgbench -i -s 4000 pgbench
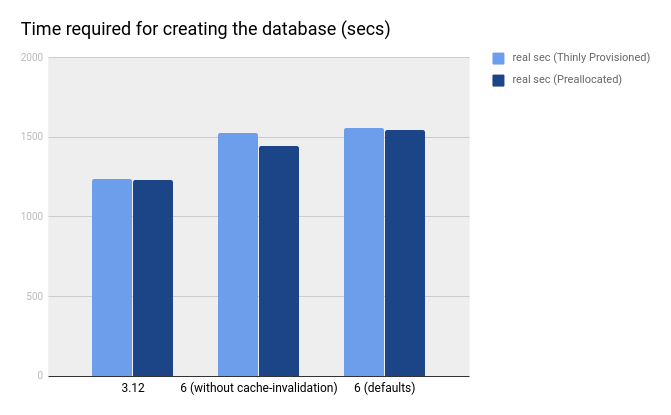
Time required for creating the database (Gluster 3.12 vs Gluster 6) Thinly Provisioned (Lower is better)
time pgbench -i -s 4000 pgbench
| Gluster ver with/out options | real |
|---|---|
| 3.12 | 20m 40.080s |
| 6 (without cache-invalidation) | 25m 24.868s |
| 6 (defaults) | 25m 56.818s |
Time required for creating the database (Gluster 3.12 vs Gluster 6) Preallocated (Lower is better)
time pgbench -i -s 4000 pgbench
| Gluster ver with/out options | real |
|---|---|
| 3.12 | 20m 30.481s |
| 6 (without cache-invalidation) | 24m 08.149s |
| 6 (defaults) | 25m 45.599s |

Time taken to create the db seems to be more in gluster-6 still investigating performance improvements.
Now let us look at some pg-bench results. Have created two disks (Preallocated & Thinly-Provisioned) . Added various parameters to check the performance. These volume options are set from ovirt-ui. Before running tests for pg-bench have run
echo 3 > /proc/sys/vm/drop_caches && sync on the hypervisor hosts.
For running auto-invalidations:false test have set the mount options for the storage domains in the ovirt-ui.
Have run the following commands three times on the vms for both the disk types and captured the results.
$ pgbench -c 10 -t 500 -r pgbench
$ pgbench -c 10 -t 1000 -r pgbench
$ pgbench -c 10 -t 2000 -r pgbench
$ pgbench -c 10 -t 4000 -r pgbench
Arguments to pgbench as -c and -t where -c=number of clients , -t= number of transactions per client
The raw data for the below results are located in : gluster-pg-bench-test-results
Note: All results are taken as an average of 3 runs.
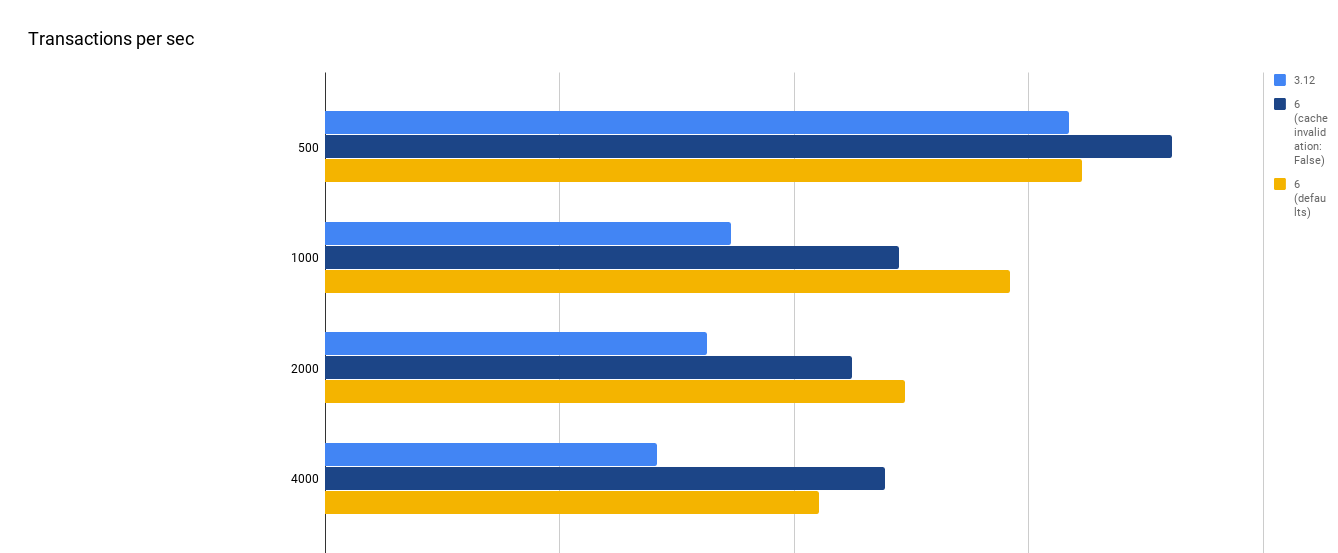
| Gluster ver with/out options (Thinly Provisioned disk) |
500 tps | 1000 tps | 2000 tps | 4000 tps |
|---|---|---|---|---|
| 3.12 | 792.38 | 432.49 | 407.42 | 353.82 |
| 6 (cache-invalidation=false) | 902.91 | 612.00 | 562.00 | 596.93 |
| 6 (defaults) | 806.86 | 729.71 | 618.55 | 526.00 |
tps: Transactions per second Higher is better
| % difference seen from gluster 3.12 (Thinly Provisioned disk) |
500 tps | 1000 tps | 2000 tps | 4000 tps |
|---|---|---|---|---|
| 6 (cache-invalidation=false) | +13.88% | +41.15% | +37% | +68% |
| 6 (defaults) | +1.87% | +68.5% | +51 % | +49% |

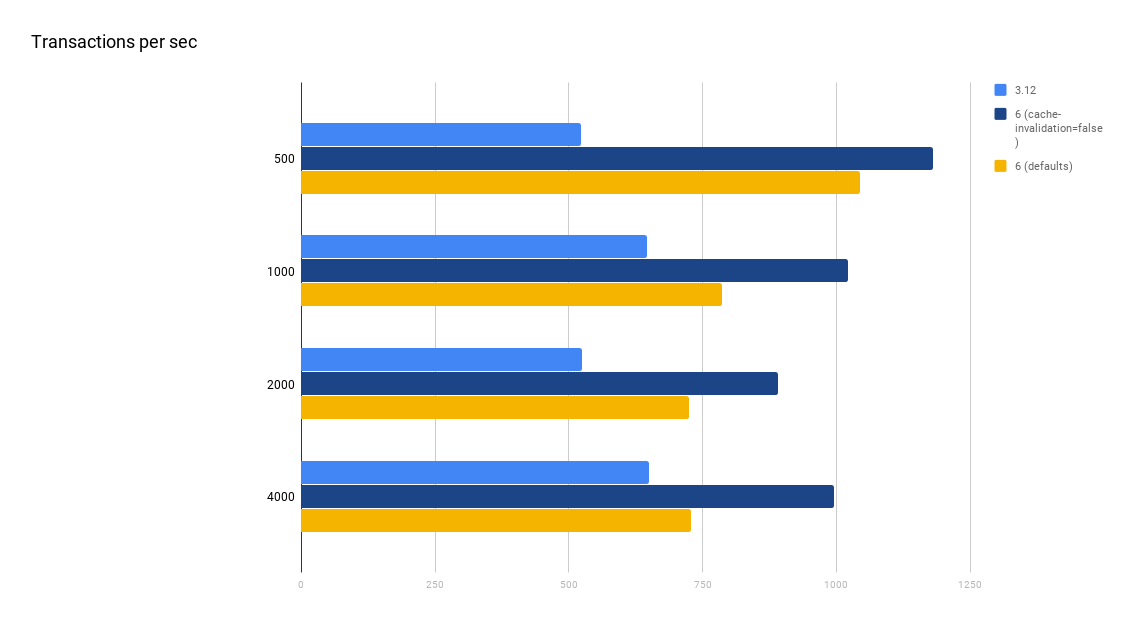
| Gluster ver with/out options (Preallocated) |
500 tps | 1000 tps | 2000 tps | 4000 tps |
|---|---|---|---|---|
| 3.12 | 522.46 | 646.91 | 524.79 | 650.52 |
| 6 (cache-invalidation=false) | 1180.74 | 1021.76 | 890.18 | 995.00 |
| 6 (defaults) | 1044.89 | 785.81 | 725.06 | 727.44 |
tps: Transactions per second Higher is better
| % difference seen from gluster 3.12 (Preallocated) |
500 tps | 1000 tps | 2000 tps | 4000 tps |
|---|---|---|---|---|
| 6 (cache-invalidation=false) | +126% | +57% | +69% | +53% |
| 6 (defaults) | +99.97% | +21% | +38% | +11.8% |

There is indeed a performance improvement seen with gluster-6 for certain workloads especially without cache-invalidations, although there is a ~12% performance drop while creating the db.
Hope this data helps in understanding the various improvements and bottlenecks seen in the gluster-6. I am also working on making these tests automated for running with each new gluster release ezio-auditore/pg_bench_test_automation. Comments and suggestions are welcome.
 Gluster Developer Blog posts